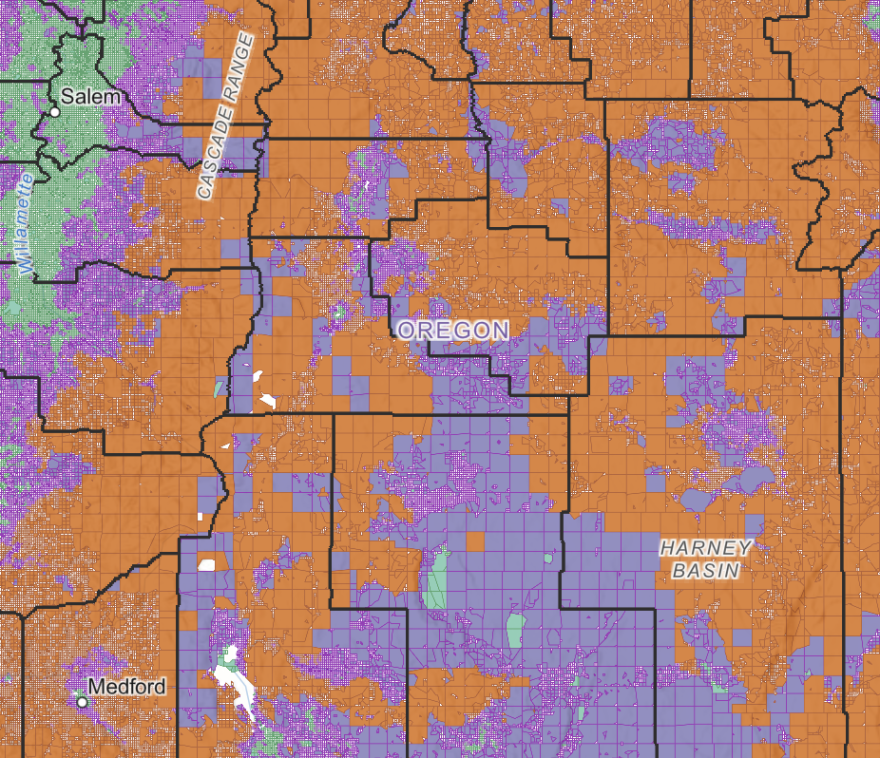
Last week the Oregon Department of Forestry and Oregon State University researchers released a showing relative wildfire hazard throughout the state. They define wildfire hazard as a combination of how likely a wildfire is to occur and its potential intensity.
The release comes two years after the state published a similar map, then called a “wildfire risk map,” before pulling the graphic over outrage from residents about how the information would impact property values and insurance rates.
Whitney Bryd’s property in Jackson County’s Eagle Point, along with large swathes of land across Oregon, was labeled “high risk” in that previous version. She didn’t think that was fair.
“Our house was probably lower risk than anybody living in town even. We don't have any wooden structures around our house. We have very few trees,” said Bryd. “And we have short, irrigated pastures all the way around.”
She said the first thing she did when that map was released was call her insurance agent. She didn’t see a change in her plan although others in a Facebook group she joined, ODF Wildfire Risk Map Support, expressed their worry the map was a reason for their rising premiums. Oregon later passed a law banning the use of the map in determining insurance rates or coverage.
“Our public outreach effort two years ago was terrible. And we know that,” said Democratic state Sen. Jeff Golden, D-Ashland, who supported
requiring the mapping.
This time around the state has focused on more public outreach to assuage fears like Byrd’s, hosting meetings in high-hazard areas in southern, central and northeastern Oregon. Golden said he has walked properties with those unhappy over their previous high-risk classification and has done his part in explaining the context behind the map and its need.
“We needed to know where the highest hazard places were so resources, attention, expertise, grants, all kinds of things could be concentrated. That's the context,” said Golden.
Other than public outreach, the color scheme of the new draft map has changed and there are fewer categories of wildfire hazard — three compared to five. Some irrigated land, like Byrd’s, has also been excluded from the highest hazard category.
But, as Golden explained, it’s not a drastically different map.
“The reaction I get from people is very mixed, from gratitude that the state’s taking this so seriously… to a lot of anger and mistrust. Especially since our false start two years ago,” said Golden.
Whitney Byrd in Eagle Point said her property, surrounded by irrigated pasture, is now labeled as moderate hazard rather than high risk. But she’s still worried how the information will impact her property value or be used to require her to cut trees on her land to create a defensible space against fire.
The state will use a wildland urban interface map developed by ODF and OSU, which describes transitional zones between wildlands like forest and human developments, along with the hazard map to identify properties that will eventually be required to follow defensible space and building code rules.
When asked what she thought of the map’s context which Sen. Golden wants residents to understand — its purpose of helping the state prioritize communities with the highest need for hazard mitigation — Byrd said that “sounds just like a politician that lives right downtown…. He has no reality of how this is actually going to affect people that live rurally.”
The draft map is open for public comments through August 18 with a final version expected in October. Virtual public hearings will be held on July 31 and August 1. More information can be found on the .


